 Первая страница
Анализ Армянской ДНК-Научная ДНК Армянский Расы-Генеалогия Армянский Расы

Анализ Армянской ДНК-Научная ДНК Армянский Расы-Генеалогия Армянский Расы
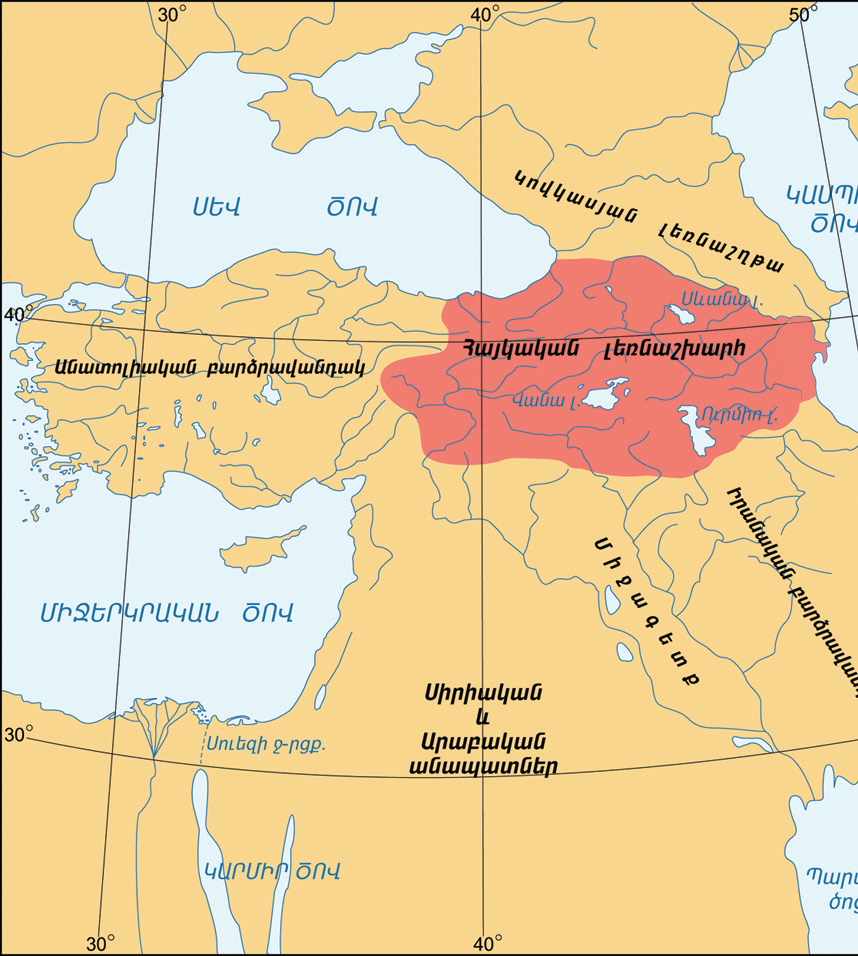
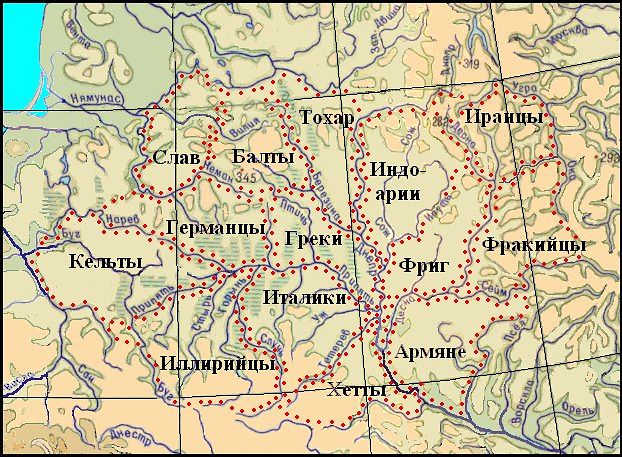
Армянское Нагорье Большая часть Армянского нагорья находится в пределах современных Турции и охватывает всю Армению. К Армянскому нагорью относится также западная часть Ирана, юг Грузии и западная часть Азербайджана.

Армянское Нагорье и Армянский Тавр
,Хетты.jpg)
Армянское Нагорье
Армяне принадлежат к 13 различным генетическим группам, возраст которых датируется десятками тысяч лет, и в то же время в ДНК у армян в последние 4000 лет нет никаких следов от захватчиков, что делает их ” гомогенными во всём своем многообразии”
Анализ Армянской ДНК.
1) Институт молекулярной и клеточной биологии Отдел эволюционной биологии Урмас Русталу М н. RVA-Лиз Лугвали Профессор д-р Ричард Виллемс Тарту 2004 “В нашем исследовании предки армян восходят к различным частям Армении, Грузии, Азербайджана и Турции, что свидетельствует о том, что историческая Армения была гораздо большей территорией, чем в настоящее время Республика Армения”.
2) Баноей, Чалештори, Саньати, Шариати, Хаушман, Маджидзаде, Солтани и Голиапур (2007) Разновидность DAT1 VNTR Аллелей и Генотипов Среди Старых Этнических Групп в Месопотамии до Области Окса . ” Армяне – нация и этническая группа выходцев с Кавказа и восточной Анатолии, где пребывает большая концентрация этого сообщества, особенно в Армении “.
3) (Мовсесян и Кочар 2000) “Черепное сходство между современными армянами и жителями Армении 1600 – 700 до н.э. указывает на непрерывность генетической связи с древним населением”
4) «Армяне – отдельная этническaя группа, которая возникла из неолитических племен Армянского нагорья ” Литвинов С *, Кутуев А, Юнусбаев В, Р. Хусаинова, Валиев Р, Хуснутдинова E.
5) 40% армянских генов восходит к эре палеолита. Левон Епископосян
6) Армяне принадлежат к 13 различным генетическим группам, возраст которых датируется десятками тысяч лет, и в то же время в ДНК у армян в последние 4000 лет нет никаких следов от захватчиков, что делает их ” гомогенными во всём своем многообразии”.
“ B результате тестирования более чем 300 лиц, выяснилось, что армянские ветви ДНК лежат в основе многих ветвей Европы”.
Проект армянской ДНК в Family Tree DNA
Разные народы в разное время использовали разные названия для Армении и армян.Шумеры примерно в 2800 г. до н.э. называли Армению Аратта, а аккадцы, сменившие шумеров во второй половине третьего тысячелетия до нашей эры, – Армани или Арманум. Хетты, появившиеся во втором тысячелетии до нашей эры, применяли для обозначения Армении название Хайаса, а ассирийцы, возникшие во второй половине второго тысячелетия до нашей эры, – Уруатри или Урарту (Арарат в Библии).
С исчезнованием с исторической арены народов, называвших так Армению и армян, ушло также и использование этих названий. Но Армения и армяне, всегда находившие силы и возможности для обновления на протяжении всего этого времени, продолжали и продолжают жить.
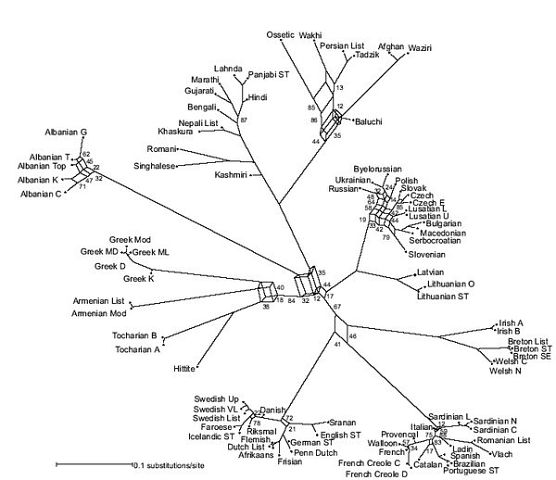
Аратта считается первым армянским государством, упомянутым в древних текстах. Это записи древнейшего шумерского Эпоса о Гильгамеше. Считается, что этим текстам примерно 4 800, но это не значит, что государство Аратта не существовало и до этого. Квентин Аткинсон и Расселл Грей доказали, что армянский язык уже был выделен из общего праиндоевропейского на Армянском нагорье, прародине индо-европейцев, около 8 500 лет назад. Следует помнить при этом, что древние армяне построили храмовый комплекс Портасар около 12 000 лет назад, что говорит о наличии высокого уровня организации общества, безусловно, необходимого для выполнения такой грандиозной по меркам того времени работы.
///////////////////////////////////////////////////////////////////////////////////////////////////////////////////////////////////////////////////////////////////////
Origin of Armenians & Genetic Studies
1) “In our study the ancestry of the Armenians was traced back to different parts of Armenia, Georgia, Azerbaijan and Turkey, illustrating the fact that historic Armenia was a much larger territory than that of the present Republic of Armenia”.
University of Tartu Faculty of biology and geography Institute of molecular and cell biology Department of evolutionary biology Urmas Roostalu M Sc. Rva-Liis Loogvali Prof Dr. Richard Villems Tartu 2004
/////////////////////////////////////////////////////////////////////////////////////
Происхождение Армян Генетические & Исследования
1) “В нашем исследовании предки армян восходят к различным частям Армянского Нагория-Армении-Р.Армении,Р.Арцаха, Грузии, Азербайджана и Турции, что свидетельствует о том, что историческая Армения была гораздо большей территорией, чем в настоящее время Республика Армения”.
Институт молекулярной и клеточной биологии Отдел эволюционной биологии Урмас Русталу М н. RVA-Лиз Лугвали Профессор д-р Ричард Виллемс Тарту 2004
///////////////////////////////////////////////////////////////////////////////////////////////////////////
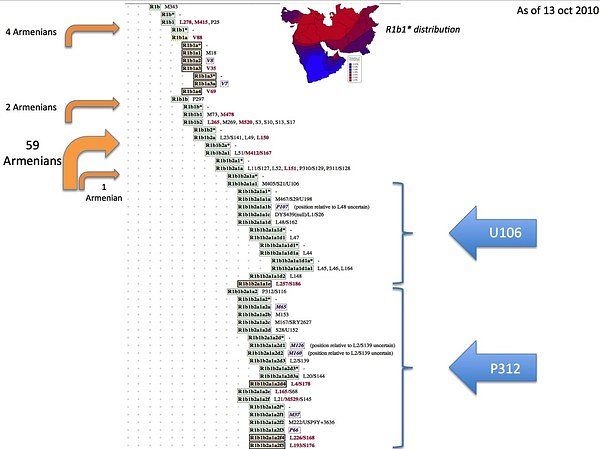
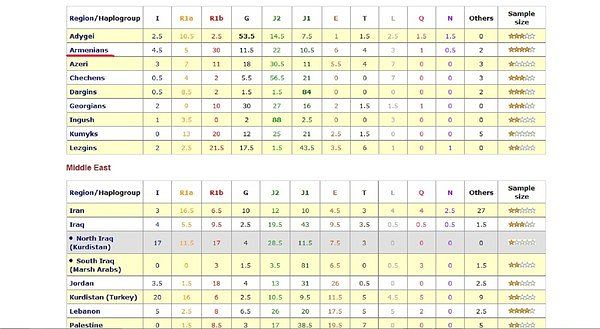
Армяне по своим гаплотипам распределяются на две основные группы. Одна почти совпадает с атлантическим модальным гаплотипом (АМГ)
14-12-24-11-13-13 (АМГ)
У армян этот второй по значимости гаплотип выглядит так:
14-12-24-11-13-12
Оба они принадлежат к европейской гаплогруппе R1b. Всего из 734 человек, тестированных в Армении, такой гаплотип с мутационными вариациями имеют 220 человек (30%), включая 92 из Карабаха.
Основной же гаплотип – ближневосточный, из гаплогруппы J2. Это не ГДК, который из гаплогруппы J1, но близок:
14-15-23-10-11-12 (армянский «базовый» гаплотип, АБГ)
Как видно, он почти совпадает с ГДК
14-16-23-10-11-12 (ГДК)
Всего из тех же 734 человек 340 имеют основной армянский, «базовый» гаплотип АБГ (46%). Естественно, поскольку он всего на один шаг смещен от ГДК, в мутационном облаке вокруг этого гаплотипа находятся и те, которые визуально совпадают с ГДК. Но они – «осколки» армянского базового гаплотипа. Вот статистическое подтверждение:
14-15-23-10-11-12 (36 чел.) 0 мутаций (АБГ)
14-16-23-10-11-12 (14 чел.) 1 мутация от АБГ (ГДК)
Уже видно, что основной, «базовый», корневой гаплотип (АБГ) – не ГДК, а другой, из гаплогруппы J2. Он мутировал всего на один шаг, и дал псевдо-ГДК.
Но продолжим ряд. Равноправные гаплотипы армянского базового АБГ, тоже отстоящие на одну мутацию, следующие:
14-14-23-10-11-12 (11 чел.) 1 мутация от АБГ
15-15-23-10-11-12 ( 7 чел.) 1 мутация
14-15-22-10-11-12 ( 4 чел.) 1 мутация
14-15-24-10-11-12 ( 4 чел.) 1 мутация
13-15-23-10-11-12 ( 3 чел.) 1 мутация
И так далее. Всего таких гаплотипов, отстоящих на 0-5 мутаций от «базового». 105 вариантов, и принадлежат они 251 человеку. Всего на это количество людей приходится 581 одиночная мутация. Отсюда, «коэффициент патриархов» равен 2.31.
Уже видно, что базовый армянский гаплотип очень старый, один из старейших из рассмотренных нами. Умножаем его на коэффициент 2666, как рассказывалось выше, и получаем, что носитель исходного базового гаплотипа для армянской популяции жил 6200 лет назад, то есть за две с половиной тысячи лет до исхода Авраама из Ура в Ханаан.
Ясно, что этот гаплотип и его мутации прямого отношения к гаплотипам 12 колен не имеют.
Кстати, такой же срок упоминался мной в другом повествовании, как время создания сладкого винного винограда в древней Армении и первого производства относительно качественных вин. Талантливы и трудолюбивы были армянские предки, как, впрочем, и их потомки.
Если применить такой же способ подсчета к второй по популярности базовой гаплогруппе армян («Армянской Рассы»), приведенной выше, то окажется, что на 206 человек приходится 261 мутация («коэффициент патриархов» равен 1.27), и 3400 лет назад Армянский гаплотип внедрился в Европу. Но он тоже прямого отношения к гаплотипу 12 колен не имеет.
Интересно под этим углом взглянуть на Карабах, по которому есть отдельные данные. После распада и захвата Татароми ковказкой Албани часть Удинов пресекли Кур и Пасиликис в Утике и в Арцахе.Пасколку Удини Это смез Персов,Иранцов и Афтаномних жителей Ковказкой Албании -Армян и Удини испаведоволи всегда ту же веру что и асталне Армяне,то ани стали вайдти в брачние саюзи с местноми Армянсоми(Арцахскоми и Уткискоми Армяномы)!
Тоисть в Армяно -Удин Арцаха и Утика есть Иранская Кров-Но есть факт что Иранци тоже принадлижат к Арм рассе то палучаетца то ани в рассовом смисле падчти честакровние!
В этом случае на 70 человек с ближневосточными гаплотипами приходится 140 мутаций на 1-5 шагов, что означает, что этот гаплотип принесли на землю Карабаха около 2513.5(2213.5) лет назад(500(300) год до нашой ери в Агванк пападают иранские племена), опять намного познее появления гаплотипа 12 колен. А Чисто Армянский гаплотип, который имеют 82 человека из выборки, в котором насчитывается 93 мутации, был всегда афтаномним в Карабахе(Арцахе и Утике).
/////////////////////////////////////////////////////////////////////////////////////////////
Наконец, имеется небольшая выборка по иранским Армянам(Айоц Атрпатаканским,Пайтакаранским, и Паркаайкским), которые, как полагают, были вывезены в Исфахан (центральный Иран) войсками шаха Аббаса в 1604 году нашей эры.
Из этой выборки 25 человек показали 52 мутации на 0-5 шагов от ближневосточного гаплотипа, что дает время появления гаплотипа у прародителя этих людей 2513.5(2213.5) лет назад, а Армянский гаплотип у них появился 5500 лет назад (17 человек с 25 мутациями на 0-5 шагов).
Естественно, при столь ограниченной статистике трудно рассчитывать на надежные данные, но общий порядок появления двух основных гаплотипов у армян в целом совпадает – около шести тысяч лет назад
Ливанский тип Армянской рассы типу(по ближневосточному) гаплотипу 14-15-23-10-11-12,
Армянский тип Армянской рассы - гаплотипу 14-12-24-11-13-12. примерно три-четыре тысячи лет назад
Гаплотипа 12 колен как «базового», или «корневого» они идентичны.
Про Карабах(Арцах и Утик) проясню от себя, эта область находится на самой границе армянского нагорья, местность крайне суровая и труднопроходимая (густые леса, скалы) и появлении там армянского гаплотипа объясняется тем что время для того чтобы дойти и освоить эти территории.
Есть привязка времени появления гаплотипа у предка к географическому ареалу обитания?
Ведь с "окраинным" Карабахом (Арцах и Утик - куда пришли чуть позже) - сразу появляется разница в возрасте предка по сравнению с "центральным" ареалом обитания.
Т.е. армяне имеют единого предка по мужской линии, жившего 6200 лет назад на армянском нагорье (исторический ареал обитания армян по сей день).
Позже, 2513.5(2213.5) лет назад к ним добавляется ещё один небольшой массив населения с общим Армянским предком. С тех пор генетическая картина на Нагорье особо не меняется.
Если конечно не считать геноцид армян турками на большей части армянского нагорья в 1915-1921, в ходе которого было уничтоженно почти 2 млн армян и соответсвенно большую часть армянского нагорья заполонили турки и курды.
Я надеюсь компетентные пользователи этого форума помогут мне разобраться с одним вопросом.
//////////////////////////////////////////////////////////////////////////////////////////////////////////
Что касается наличия сразу двух гаплогрупп-С одной стороны кажется что к коренному базовому составу протоармян (J2) присоеденилась некая пришлая на нагорье народность (R1b).А ведь действительно было быть наоборот, как Вы и очень точно подметили.
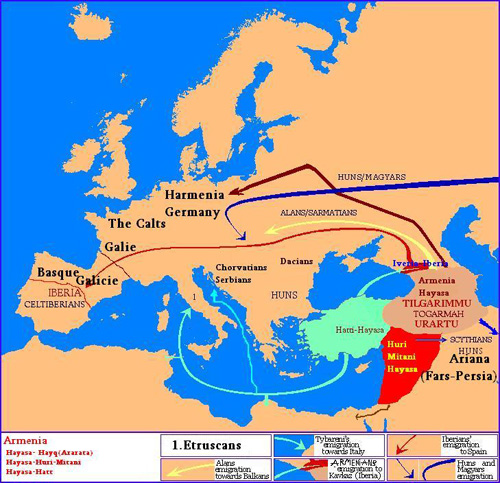
Европейская народность пришла из Армянского Нагория в Европу
В этом контексте "всплывает" очень интересная гипотеза, которая может пролить свет на всё это и помочь собрать мозаику в единую картину.
Я имею ввиду Гиксосов. По порядку...
1-ая Официальная тероя
Эсть жидовская Официальная тероя и самая распространенная теория что якобы это Гиксосы семитские качевники качевие предки еврвйов семитов!
1-ая Официальная тероя теория о "гиксосах" такая, мол в 1700-1650 годах д.н.э. Армянские племена кочевников захватили власть в древнем Египте. Основали свою столицу (Аварис) и правили Египтом больше 100 лет, за это время по разным данным сменилось 6-7 "гиксовских" царей.
Но в этой теории очень много ляпов и подстановок, а так же слишком много того что указывает совсем не на семитских кочевников-скотоводов. Причем даже не одним заставляющим задуматься фактом, а целым набором, причём взаимосвязанным.
Сам факт. Как могло племя кочевников-скотоводов покорить пусть и ослабшую, но всё же великую цивилизацию. Причём не просто покорить, а править ею больше 100 лет? - Никак
2-ая Официальная тероя
2-ая Официальная тероя и самая распространенная теория о "гиксосах" такая, мол в 1700-1650 годах д.н.э. Армянские племена -неаследая часть Армянского народа захватили власть в древнем Египте. Основали свою столицу (Аварис) и правили Египтом больше 100 лет, за это время по разным данным сменилось 6-7 "гиксовских" царей.
1. Название. Такое название "Гиксос" (точнее hyksos/hайксос) следует из греческих источников.
В попытке связать его с египетским лексиконом "ученые" подогнали под это дело египетское "hqa xaswt" (хекау кхасут) - правители чужой страны, или - правитель чужих стран. При этом не утруждаясь объяснить каким образом греки могли так сильно исказить это название. Поэтому остановимся на греческом оригинале, а не на "додумке" о египетском значении.
Окончание "сос" явно греческое добавление, которое прикрепилось в результате стараний элленизированного Манефона, Иосифа Флавия и Евсебия Кесарийского (основные источники о hайксосах). Когда убираем окончание "сос", остается оригинальный вид слова - "hайк". А теперь фокус.
Самоназвание армян во все времена было "haй" (армянин), а на древнеармянском окончание -к давало множественное число "haйк" (армяне). Связано оно с легендой об отце-прородителе всех армян по имени Hayk.
Дальше больше...
2. Покорить небольшой армией и удерживать Египет больше века могла только пришельцы с напорядок более высоким уровнем технологического развития, к коим понятное дело семитские скотоводы-кочевники не могли относится. Этот пункт (а так же первый) подтверждается археологическими находками:
3. Достоверно известно что Хайксосы прибыли на колесницах, это подстверждается как египетскими изображениями, так и сохранившиеся в пирамидах экземпляры колесниц Хайксосов. Ни у Египтян до этого, ни тем более у семитских кочевников колесниц в это время не было вовсе.А в Армении в Айасе исползоволы Колесницы.
4. Колесницы были выполнены из древесины дерева росшего в те времена лишь на территории армянского нагорья (Армении). Сомневаюсь что семиты тащились бы за древесиной к нам на нагорье...
5. Более того. В конструкции этих самых колесниц были обнаружены железные детали, что говорит о том что Хайксосы обладали технологиями развитой металургии (обработка железа). Их оружие так же было железным, о чём свидетельствует например рассечённый через бронзовый шлем череп последнего фараона Среднего царства. Египтяне до Хайксосов владели лишь бронзой, неговоря уже о семитах-скотоводах.
6. Идём дальше. Где в то время была развита металургия? Ни в степях средней азии, ни на территории современной Персии железо ещё не обрабатывалось. А обрабатывалось оно в то время на армянском нагорье. Об этом свидетельствую археологические раскопки, нашли целый ряд металаплавителных центров (например в Мецаморе), где уже в начале 2-ого тысячелетия в широком масштабе плавили металл.
7. и в подтверждение 6 пунктта -именно Армянское Нагорье, а не соседние регионы, богато железной рудой, которое, и это доказали археологи, начали добывать уже в 3-ем тысячелетии.
8. Хайксосы говорили о том что у них есть свой царь (в их родной стране) и называли его Хианом. В армянских легендах есть сказания про армянского цара по прозвищу Хианали, "хианали" в переводе с армянского - прекрасный.
9. Столицу они назвали сначала Хайару, а потом переименовали в Аварис. Оба названия имеют армянское толкование. Хай-ару переводится буквально "армянский мужчина", такое название можно связать с тем что город поначалу представлял из себя военный лагерь, в ктором жили одни мужчины. Что касается Аварис, то тут всё вообще четко - дословный перевод "мой трофей".
10. Менее значимый и четкий факт, но тем не менее так же известно что Хайксосы называли свои колесницы "варака", на армянском глагол "варель" - водить, Причём применяется в таком виде лишь когда идет речь об управлении каким либо транспортом.
11. По описаниям и найденным изображениям "гиксосы" очень напоминают Армянской рассы - арменоидов. В частности большие глаза миндалевидной формы - "фишка" армян.
12. В пантеоне ”hайксосов" ведущее место имел бог грозы и его жена Анаит. Богиня Анаит есть главная богиня армянского пантеона, а ”бог грозы” есть армянский бог войны Вааг, который считался властелином грозы.
13. Правящая династия ”hайксосов" в источниках называется ”hекаказут” (С. Галямов ”Башкорды от Гильгамеша до Заратуштры”, Уфа 1999), что не что иное, как название одной из ветви армянского царского рода того времени ”hайказуни” и на деле имеет вид ”hайказут” (”зут” имеет уменьшительно-ласкательное значение в армянском и символизирует то, что ”hайказут”- ”младшие братья” правящего дома ”hайказуни”).
14. ”hайксосы" ввели в Египте 12 знаковый зодиак, а согласно одной гипотизе он появился именно на армянском нагорье, ибо только в фауне и культуре армянского нагорья есть весь набор представителей 12 знаков - ни одна другая страна В КОМПЛЕКСЕ не имеет Овна, Козерога, Тельца, Льва (были очень распространенны на армянском нагорье), а также Водолея (на Армянском Нагорье культ воды был крайне развит), Стрельца (Бог армян того времени, Айк, имеет образ стрельца(лучника)). О степени развития астрологии у армян говорит и то что на территории армянского нагорья было найдено несколько древних абсерваторий. Например Карахундж, возраст которого более 7500 лет. (ссылка)
15. Именно в период 1750-1650 гг д.н.э. (ни раньше ни позже) у армян была отличная возможность для таких глубоких походов на юг, ибо все страны-соседи с юга которые могли бы оказать этому сопротивление были в тот период крайне ослабленны либо еще не расцвели настолько:
Кстати, именно в последнем случае мы имеем прямое доказательство – по данным клинописей именно в 1700-ом году в Асирии закончилась борьба за власть, что без сомнения можно объяснить завоеванием арменоидами. Более того, по сведениям арабских источников (Масуди) армяне победили ассирийского царя Арсиса (видимо имеется ввиду Адаси, который процарствовал меньше года и именно в 1700-ом), после чего 20 царей Ассирии в течении 273 лет подчинялись армянам и платили дань...
Подитожим:
Эти пункты не только объясняют то как могла небольшая армия чужеземцев поработить великиую цивилизацию более чем на век (благодаря технологическому превосходству), но и заставляет скептически отнестись к теории о семитском происхождении Хайксосов и взглянуть по другому на вопрос об их происхождении. Ибо такое количество "совпадений" не может быть случайностью
К чему я вообще написал про Хайксосов и как это связано с гаплогруппами. Обратите внимание на период упоминаний о Хайксосах - примерно 3500-3700 лет назад. Это именно тот период, когда у армян появился второй гаплотип - R1b. Учитывая всё вышесказанное про Хайксосов, а так же полное совпадение по времени появления у армян гаплотипа R1b можно предположить следующий сценарий.
Возможно древние армяне (у которых ещё была лишь группа J2) примерно 3500-4000 лет назад совершили несколько дальних военных походов с армянского нагорья. Как писалось выше, некоторые ученые называют более точные даты 1750-1650 годы д.н.э. относительно походов на юг (Египет), о чем было сказано чуть выше.
И тут встает вопрос! Если древние армяне, могли себе позволить подобные военные походы с армянского нагорья на юго-юго-запад, то им тем более ничего не мешало совершать подобные же походы на запад, чрез Босфор в Европу?
Армяне дойдя до европы - продолжительное время там обитали (пару тройку сотен лет), ассимилировали какое-то местное население и впоследствии вернулись обратно, вдобавок к новым генам в себе приведя с собой определенную часть европейцев. К тому же продолжительное обитание на совершенно другом ареале так же может способствовать мутациям
Скорее всего древние армяне совершили поход в том числе и в этом направлении, впоследствие "принесли" с собой на армянское нагорье западноевропейский гаплотип R1b.
P.S.
Вообще история армян достаточно прозрачна и неоспорима в основе вплоть до ~1000 года д.н.э. А сценарии "до этого" - есть разные.
10000 и более лет назат сформировалась наша нация . В поддержку аргументы есть, правда немного. Правда эти "осколки" порой собираются в очень четкие логические цепочки. Но к сожалению процесс глубоко познания затрудняет множество факторов.
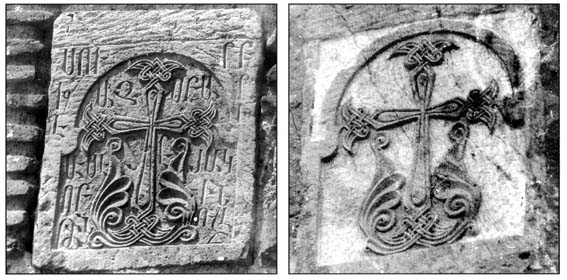
1. Армяне воевали практически всю свою историю, наши противники зачастую не брезгали попытками массового истребления, уничтожения культурного наследия. Многое было утрачено в последствии войн, зависти соседей и жажды присвоения. Кстати жажда присвоения есть и по сей день, например в той же Грузии она обрела второе дыхание, об этом можете почитать тут. Там документы, фото... вот один из огромного числа примеров "грузинизации" армянских памятников из этого материала:
///////////////////////////////////////////////////////////////////////////////////
Фото из монастыря Святого Геворга. На фото Хачкар (камень-крест) установленного в памяти об Отце Hakob'e в 1681. В 1997 были соскоблены армянские надписи с хачкара...
2. Мощный удар по материальной базе истории Армении языческих времен нанесла армянская церковь. Дело в том что после принятия христианства в 301 году (певые в мире), церковь в страшных масштабах уничтожала языческое наследие, главным образом храмы, рукописи (которые так же хранились в храмах). Из языческих храмов на территории ненешней Армении остался цел один Гарни, и то благодаря тому что сестра царя попросила его оставить в качестве резиденции. Церковь согласилась при условии что буквально в 5 метрах будет возведена церковь. Кстати на фото справа у подножия языческого храма видны остатки фундамента церкви, которая спустя сотни лет была разрушена в результате землятресения.
3. Сейчас вести раскопки на армянском нагорье нереально, туркам это ой как не выгодно...они за последние 90 лет уничтожили большинство армянского культурного наследия в западной Армении, а тут ещё и новое раскапывать... Пока там турки - ничего армянского там найти будет нельзя, а если и будут находить случайно - то все следы принадлежности к армянам будут уничтожаться, либо если это нереально - уничтожаеться сама находка.
//////////////////////////////////////////////////////////////////////////////////////////////////////////////////////
Гарни

Кстати про арийцев.
Самоназвание Ари, слово “АРи”. Не один народ в мире, не имеет столь сильной связи с этим понятием и словом, как АРмяне/АРмены. Более того, не в одном языке слово “АРи” не имеет ТАКОГО ПОЧЕТА (“АРи”=“смелый”, “АРи” =“мужское начало”, “КаджАРи”=“отважный”, “АР”=“мужчина”, “АРтакарг”=“супер” и тд), ни в одном языке мира нет столько названий с корнем АР (АРАРат - святая гора армян, АРагац, АРгейос, АРАРатское царство; провинции Великог Айка - АРАРат, АРцах, уезд АРк, АРтаз, АРагацотн; города АРмавир, АРташат, АРабкир, АРдаган, АРдвин, АРеш, АРчеш, АРзрум, АРцап, реки АРакс, Арацани, крепость АРтагерс и тд) и не в одном языке мира нет столько личних имен с “АР”-ом (Армен, Арман, Артак, Арам, Аргам, Ара, Арташес, Арутюн, Артавазд и много ещё).
Первые цари Ариев, имена которых сохранены в Авесте имеют явно армянские имена. Так - Айомарт (в переводе с армянского дословно - “человек Армянин”), Айосинга (в переводе означает просто “Сын Айа” сын предыдущего), Аждаа (по армянски в переводе означает “Великан”), Тиран-Тарон (/Траетаона/, Тиран и Тарон типично армянские имена), Манучар (опять типично армянское имя), Назар (то же), Аршасп (“Аршам”, типично армянское имя).
И в этом вопросе огромное количество стыковок. Не говоря уже об огромном количестве свастик/солярных знаков на армянских храмах, церквях, доспехах и оружии воинов.
Вот к примеру руины древней армянской столицы Ани
Кстати самое главное забыл то. АРев - солнце, а так же два популярных символа - орёл и лев - АРцив и АРуйц соответственно.
////////////////////////////////////////////////////////////////////////////////////////////////////////////////////////
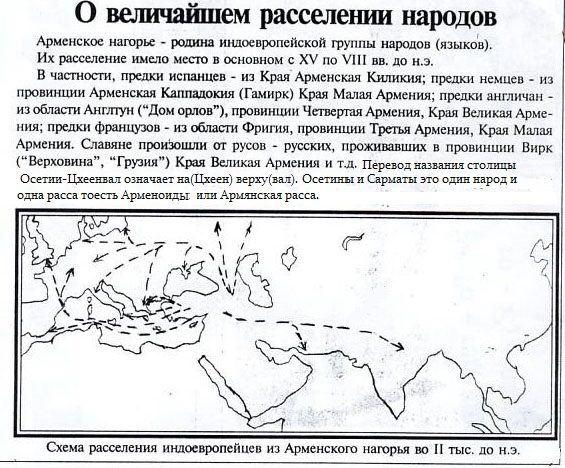
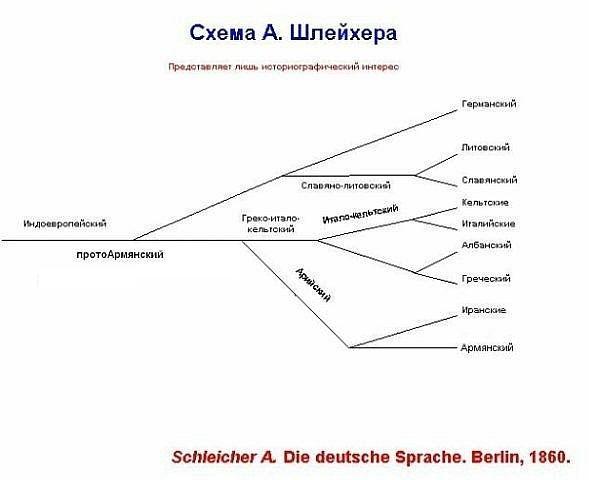
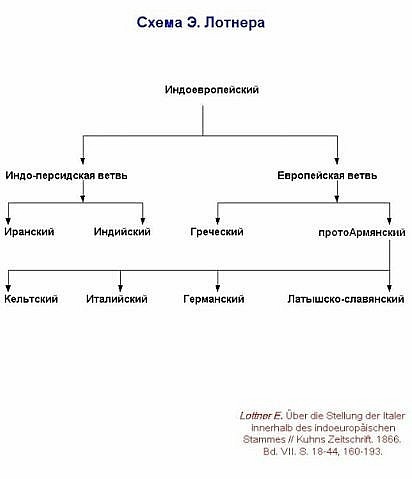
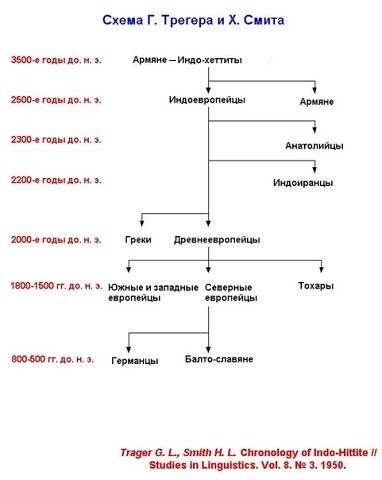
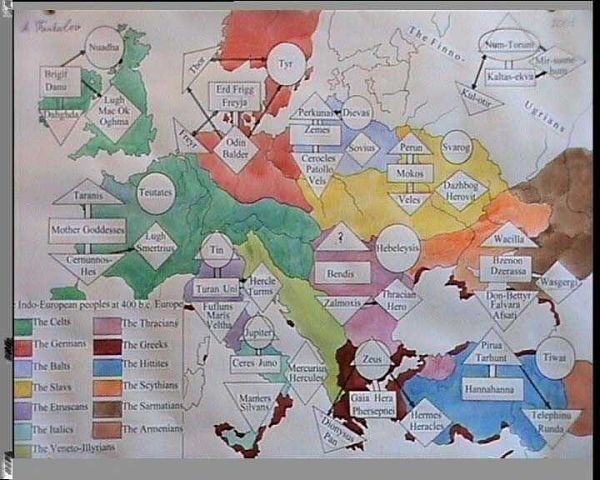
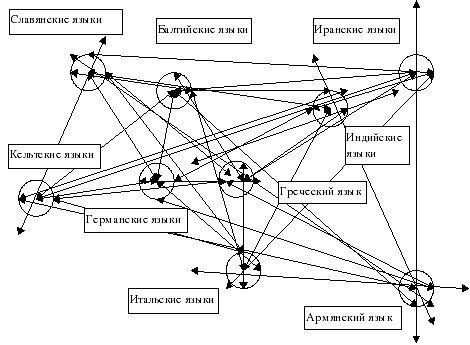
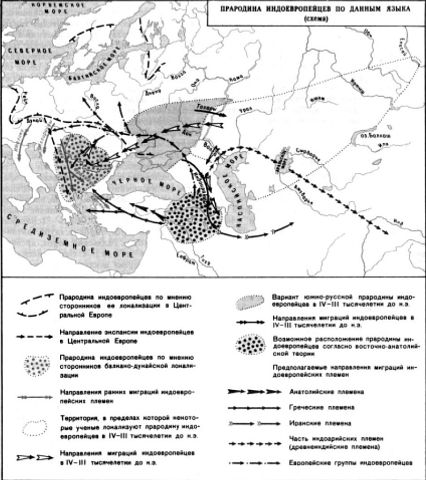
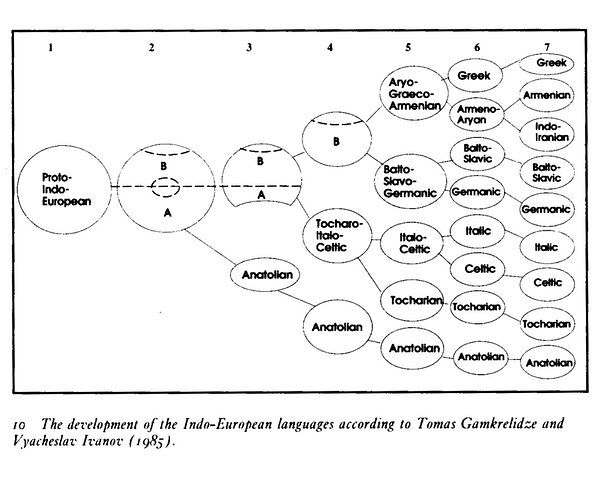
Схемы-Армянскоий Расы


/////////////////////////////////////////////////////////////////////////
Нам хочется разобраться с прошлым своим предков (до 1000 г.д.н.э.). К сожалению пока наши западные земли оккупированы турками - практическое и глубокое изучение невозможно.
.jpg)
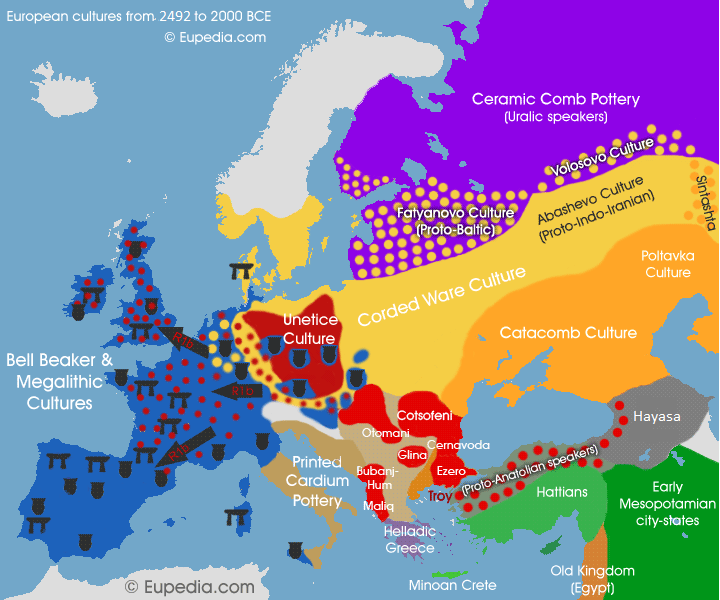
2492

То, что армяне являются коренными жителями Армянского нагорья, уже хорошо известно в следствии исследований в области генетики. Например исследования Haber et. и др. (2015), выявили непрерывный армянский ген на Армянском нагорье в течении 4000. В результатах теста говорится:
«Наши тесты показывают, что армяне не имели существенной смеси с другими популяциями в своей недавней истории и поэтому генетически изолированы с конца бронзового века».
«Позиция армян в глобальном генетическом разнообразии уникальна и, по-видимому, отражает географическое положение Анатолии (читай Армянского нагорья, как и далее по тексту). Принятие армянами самобытной культуры на ранней стадии их истории привело к их генетической изоляции от их окружения ».
Тот же вывод был сделан Hellenthal et. и др. (2014 г.) в их генетическом атласе Genetic Atlas of Human Admixture History,, опубликованном в журнале Science. Из-за таких выводов некоторые ученые ссылались на современных армян как на «Living Fossil».
Другие исследования, посвященные изучению древней ДНК, собранной из захоронений, выявили генетическое сходство между современными армянами и древними жителями Армянского нагорья.
Allentoft et al. (2015), например, наблюдаемые генетические сходства между индивидуалами бронзового века (около 3500 лет назад) и современными армянами, и Lazaridis et al. (2016 г.) показали сходство между Медным веком (приблизительно 6 000 лет ВР) с лицами бронзового века (около 3500 лет назад), раскопанными в Армении.
Подготовленные такими выводами, заведующий лабораторией Института молекулярного биоразнообразия Национальной академии наук Левон Епископосян заявил на пресс-конференции, что:
«Результаты генетических исследований показали, что образцы ДНК лиц бронзового века, обнаруженные на территории Армении, имеют генетическое сходство, с генетикой людей современных людей, живущих сегодня в Армении», «Современные армяне — прямые потомки людей, которые жили на территории Армении 5000 лет назад».
Подобные заявления были сделаны в известном genetics blogger Dienekes, где он подтверждает армянскую генетическую непрерывность, но спрашивает, распространяется ли эта преемственность за пределы бронзового века:
«Говоря о Кавказе / Ближнем Востоке, при ближайшем рассмотрении становится ясным, что армяне бронзового века почти не отличаются от современных армян. Сохраняется ли генетическая преемственность армян в более ранние периоды?».
Новые свидетельства показывают, что эта преемственность действительно простирается за пределы бронзового века (основанная на тестах ДНК Митохондрии), возвращаясь вплоть до 7811 лет назад.
Митохондрии передаются от матерей к их детям. Таким образом, изучение митохондриальных геномов позволяет ученым проследить уникальную историю женской линии с течением времени.
Это новое исследование, исследующее древнюю материнскую ДНК из скелетных останков, раскопанных в Армении, и в Арцахе подтвердили сильное сходство с ДНК современных армян.
В исследовании “Eight Millennia of Matrilineal Genetic Continuity in the South Caucasus”, опубликованном в журнале Current Biology, было исследовано 52 древних генома из найденных останков, раскопанных в Армении и Арцахе. Калиброванные даты радиоуглерода древних образцов составляли от 300 до 7,811 лет АД.
«Мы проанализировали многие древние и современные митохондриальные геномы в некоторых частях Южного Кавказа и нашли генетическую непрерывность не менее 8000 лет»,
сказал Ашот Маргарян и Мортен Э. Аллентофт из Центра географики в Музее Natural History Museum of Denmark Дании.
«Другими словами, мы не могли обнаружить никаких изменений в женском генофонде в течение этого очень длительного периода времени. Это очень интересно, потому что за тот же период этот регион пережил множество культурных сдвигов, но эти изменения, по-видимому, не оказали генетического воздействия — по крайней мере, не на женское население ».
Исследователям было интересно изучить эту часть мира из-за ее позиции как культурного перекрестка с древних времен. Он также известен как важная область потенциального происхождения и распространения индоевропейских языков.
Исследование гласит:
Этот результат свидетельствует о том, что в течение последних 7800 лет в генофонде мт ДНК на Армянском нагорье не было серьезных генетических сдвигов. Мы находим, что самая низкая генетическая дистанция в этом наборе данных находится между современными армянами и древними индивидами, что также отражается как в анализе сети, так и на дискриминантном анализе основных компонентов.
Армяне из разных регионов, в том числе Эрзрум, Арарат и Арцах, проявили самое непосредственное отношение к древним жителям Армянского нагорья.
Понятно, что современные армянские группы и древняя группа имеют очевидные сходства.
Кроме того, в документе было отмечено заметное снижение численности женской популяции около 25 тысяч лет назад во время Последнего ледникового периода (LGM), за которым последовало быстрое (примерно 10-кратное) увеличение численности населения примерно около 10 000 лет назад (см. Рисунок ), на котором показан быстрый рост населения в период неолита, когда люди впервые обнаружили сельское хозяйство.
Эти выводы имеют важные значения для мирового научного сообщества. Похоже, что за последние восемь тысячелетий в генофонде армян не было серьезных генетических изменений, несмотря на многочисленные хорошо документированные культурные изменения в регионе.
Археологически и исторически подтвержденные миграции центральноазиатских групп (например, турок и монголов) на Армянское нагорье, похоже, не вносили значительного вклада в материнский генофонд армян.
Как географические (горные районы), так и культурные факторы (индоевропейские христиане и тюркоязычные мусульмане) могли служить барьерами для генетических контактов между армянами и мусульманскими захватчиками в XI-XIV веках н.э.
Этот район служил в течение тысячелетий главным перекрестком для миграции людей. Исследователи надеются расширить исследование, включив в него как современные, так и древние образцы из соседних стран, которые могут включать сотрудничество с исследователями в Грузии и Азербайджане.

Admixed populations should have segments of DNA from all contributing source groups (Fig. 1A), whose sizes decrease over successive generations because of recombination, and approaches have been developed to date admixture events by inferring the size of ancestry segments (1–5). Between-population frequency differences of individual alleles may provide information on ancestry sources (6, 7). On the basis of these principles, we developed an integrated approach by using genome-wide patterns of ancestry to infer jointly both fine-scale information about groups involved in admixture and its timing, allowing for the fact that migration and admixture events can occur at multiple times or involve numerous groups.
Download high-res image
Open in new tab
Download Powerpoint
Fig. 1
Ancestry painting and admixture analysis of simulated admixture.
(A) A simulated event 30 generations ago between Brahui (80%, red) and Yoruba (20%, yellow) resulted in admixed individuals having DNA segments from each source (bottom). The true sources are then treated as unsampled. cM, centimorgan. (B) CHROMOPAINTER’s painting of the same region (yellow, Africa; green, America; red, Central-South Asia; blue, East Asia; cyan, Europe; pink, Near East; black, Oceania), showing haplotypic segments (“chunks”) shared with these groups. Our model fitting narrows the donor set largely to Central-South Asia and Africa, generating a “cleaned” painting. (C) Coancestry curves (black line) show relative probability of jointly copying two chunks from red (Balochi; FST = 0.003 with Brahui) and/or yellow (Mandenka; FST = 0.009 with Yoruba) donors, at varying genetic distances. The curves closely fit an exponential decay (green line) with a rate of 30 generations (95% CI: 27 to 33). The positive slope for the Balochi-Mandenka curve (middle) implies that these donors represent different admixing sources. (D) GLOBETROTTER’s source inference, with black diamonds indicating sampled populations with greatest similarity (FST ≤ 0.001 over minimum) to true sources, white circles other sampled populations. Red and yellow circles, with areas summing to 20% and 80%, respectively, show inferred haplotypic makeup of the two admixing sources.
The GLOBETROTTER Method
Our approach gains power and resolution by using alleles at multiple successive single-nucleotide polymorphisms (SNPs) (haplotypes) (8). Given a focal population within a larger data set containing many such groups, the chromosomes of individuals in this population share ancestors with those in other populations, resulting in shared “chunks” of DNA. We used CHROMOPAINTER (8) to decompose each chromosome as a series of haplotypic chunks, each inferred to be shared with an individual from one of the other groups and colored (or painted) by this group (Fig. 1B). If the focal population is admixed, the changing colors along a chromosome noisily reflect true but unknown underlying ancestry (Fig. 1B) and so can be used to learn details of the source group(s) involved. To do this, we modeled haplotypes within each unsampled source group as being found across a weighted mixture of sampled “donor” populations (9). If a source group is genetically relatively similar to a single sampled population, then this population will dominate the inferred mixture. If there is no close proxy for the admixing group in the sample, especially likely for ancient admixture events or sparsely sampled regions, several donor populations will be needed to approximate its pattern of haplotype sharing. The focal population is then automatically a haplotypic mixture of the combined donors, because it is a mixture of the source groups. Inferring the reduced set of groups within the mixture allows us to produce a “cleaned” painting (Fig. 1B) using only these groups.
To assess the evidence for admixture and date events, informally we measured the scale at which the cleaned painting changes along the genome. Specifically, we produced a coancestry curve for each pair of donor populations, plotting genetic distance x against a measure of how often a pair of haplotype chunks separated by x come from each respective donor (Fig. 1C), analogously to ROLLOFF curves (4), and averaging over uncertain and typically computationally estimated haplotypic phase (9). In theory, given a single admixture event, ancestry chunks inherited from each source have an exponential size distribution, resulting in an exponential decay of these coancestry curves (9). The rate of decay in all curves will be equal to the time in generations since admixture (Fig. 1C) (4, 9, 10), allowing estimation of this date: Steeper decay corresponds to older admixture. Such a decay distinguishes true admixture from ancient spatial structure and should only occur in recipient but not donor groups involved in nonreciprocal admixture events. We test for evidence to reject (P < 0.01) a no-admixture null model, that is, no exponential decay in (normalized) coancestry curves, via bootstrapping (9). Multiple admixture times result in a mixture of exponentials (9); if admixture is detected, we test for evidence of multiple admixture times (e.g., two episodes of admixture or more continuous admixture over a longer period; empirical P < 0.05 in simulations), comparing the fit of a single exponential decay rate versus a mixture of rates. The curve heights (intercepts) provide complementary information to deconvolve the number and genetic composition of the ancestral sources before admixture (11). Fitted curves for all pairs of donor groups (Fig. 1C shows three examples) specify a pairwise intercept matrix, which, after normalization, we decompose by using a series of eigenvectors. Analogous to the standard use of eigenvector decomposition in principal components analysis (PCA) in genetics to estimate relative ancestry source contributions for different individuals (12), the eigenvectors allow us to estimate the relative contribution to different admixing sources (e.g., source 1 versus source 2) for each different donor group (9). Also as for PCA, admixture between K distinct source populations produces K – 1 significant eigenvectors (13), and we test for three or more admixing sources by testing (empirically) for evidence of two or more such eigenvectors (P < 0.05) (9). After iterative modeling to improve results, this allows us to attempt to “reverse” the admixture process (Fig. 1D) and to infer the haplotypic makeup of admixing source groups as well as admixture date(s) in our method, which we call GLOBETROTTER. Simulations To test our approach under diverse single, complex, and no-admixture scenarios, incorporating many of the complexities (such as unsampled or admixed donor groups) likely to be present in real data, we simulated admixture scenarios involving real (but hidden to our analysis) human populations (4, 9) and populations generated under a coalescent framework (14) incorporating inferred (15–18) past demographic events. Admixture was simulated between 7 and 160 generations [200 to 4400 years, assuming 28 years per human generation (19)] ago, with admixture fractions 3 to 50% and genetic differentiation (FST) between the admixing groups varying from 0.018 (similar to Europe versus Central Asia) to 0.185 (similar to West Africa versus Europe). Results are detailed online (figs. S3 to S7 and tables S1 and S5). All populations simulated without admixture, including those with long-term migration, showed no admixture evidence (P > 0.1). Power to detect admixture (P < 0.01) when present was 94%, and 95% of our 95% bootstrapped confidence intervals (CIs) contained the true admixture date, including cases with two distinct incidents of admixture or multiple groups admixing simultaneously. Inferred source accuracy was very high (9), with, for example, the mixture representation predicting a haplotype composition more correlated to the true, typically unsampled, source population than to any single sampled population >80% of the time. However, source accuracy was lower for admixing sources contributing only 5% of DNA, with around 40% of such scenarios yielding elevated (>25%) rates of falsely inferring multiple admixture times and/or admixing groups. Further testing demonstrated robustness of GLOBETROTTER, in simulations and real data, to haplotypic phase inference approach used, inclusion/exclusion of particular chromosomes, genetic map chosen to provide genetic distances, and the presence of population bottlenecks since admixture, whereas GLOBETROTTER admixture dating was improved relative to ROLLOFF (4, 9).
Nevertheless, there are multiple settings that we believe are challenging for our approach. First, although the admixing sources need not be sampled—often impossible because of genetic drift, extinction, or later admixture into the sources themselves—source inference is improved when more similar extant groups are sampled, and GLOBETROTTER may miss events where we lack any extant group that can separate sources. Second, sampling of several genetically very similar groups can mask admixture events they share. Similarly, a caveat is that where genuine, recent bidirectional gene flow has occurred, admixture fractions are difficult to define and interpret. However, date estimation is predicted to still be useful, and in real data the majority of our inferred events do not appear to be bidirectional in this manner. Third, even in theory our approach finds it challenging to distinguish distinct continuous “pulses” of admixture and continuous migration over some time frame (9), because of the difficulty of separating exponential mixtures (20). If the time frame were narrow, we expect to infer a single admixture time within the range of migration dates. Where we infer two admixture dates, in particular with the same source groups, the exponential decay signal could also be consistent with more continuous migration, and so we conservatively refer to this as admixture at multiple dates. Last, we only attempt to analyze populations with signals consistent with at most three groups admixing and infer at most two admixture times, and we can provide only less precise inference of sources for the weaker or older admixture signal in these complex cases (9).
Analysis of Worldwide Admixture
By using GLOBETROTTER, we analyzed 1490 individuals from 95 worldwide human groups (table S10 and fig. S12) (9), composed of 17 newly genotyped groups (21), 53 from the Human Genome Diversity Panel (HGDP) (22), and 25 from other sources (23, 24), filtered to 474,491 autosomal SNPs. We phased the individuals by using IMPUTE2 (9, 25) and used fineSTRUCTURE (8) to verify homogeneity within labeled populations, to identify genetically similar and clustered groups, and to remove outlying individuals (figs. S12 to S14 and tables S10 and S11). Of the 95 populations, 80 showed evidence (P < 0.01) of admixture, although nine could not be characterized by our approach (table S12). More than half of these have evidence of multiple waves of admixture (P < 0.05), and estimated admixture times vary from <10 to >150 generations (Fig. 2). We present individual results, for each population, via an interactive map online (26). We tested consistency of our results against a previous analysis of the 53 groups within the HGDP (11), which identified 34 groups with evidence of recent admixture. We identified (P < 0.01) admixture evidence in all 34 cases (with multiple event evidence in 15 cases) and obtained 95% admixture date CIs narrower than, but consistent with, those estimated by using ROLLOFF (9, 11). For 10 of 19 HGDP groups lacking previous support for recent admixture, GLOBETROTTER also identifies no events: In the remaining populations, admixture is inferred as occurring between genetically similar sources (FST < 0.02), a challenging setting where simulations suggest our method is more powerful (9). Download high-res image Open in new tab Download Powerpoint Fig. 2 Overview of inferred admixture for 95 human populations. (A) Coancestry curve for the Maya for Spanish donor group (inferred as closest to minor admixing source), with green fitted line showing inferred exponential decay curve and a corresponding recent admixture date (with 95% CIs). (B and C) As (A), but showing the Druze and Kalash, respectively, with different indicated donors (donors indicated are proxies for minor admixing source, inferred as closest to Yoruba and Germany/Austria, respectively) and with successively older admixture. (D) On the map (locations approximate in densely sampled regions), shapes (see legend) indicate inference: no admixture, a single admixture event, or more complex admixture. Colors indicate fineSTRUCTURE clustering into 18 clades (table S11 and figs. S12 and S13). Inferred date(s) and 95% CIs are directly below the map, with two inferred admixing sources (dots and vertical bars) shown below each date (see example for simulation of Fig. 1 at left). For multiple admixture times, these two sources correspond to the more recent event; for multiple groups, they reflect the strongest admixture “direction.” Colored dots above each bar indicate clades best representing the major (top) and minor (bottom) sources. The bar is split at the inferred admixture fraction (horizontal line, fractions <5% shown as 5%). Each bar section indicates the inferred donor group haplotypic makeup, colored as the map, for one source. Shaded boxes on the inferred admixture times denote events referred to in the text, specifically (label 1) European colonization of the Americas (1492 CE to present, fuchsia); (2) Slavic (500 to 900 CE, pink) and Turkic (500 to 1100 CE, maroon) migrations; (3) Arab slave trade (650 to 1900 CE, cyan); (4) Mongol empire (1206 to 1368 CE, purple); and (5) Khmer empire (802 to 1431 CE, orange). In several instances, GLOBETROTTER clarifies or extends previous genetic analyses. For example, a previous study (27) inferred admixture in the Maya, with best source populations the Mozabites from North Africa and the Native American Surui, speculating on the basis of historical events that this might actually represent a mixture of European, West African, and Native American ancestry sources. GLOBETROTTER inferred admixture between three groups in the Maya dating to around 1670 CE (9 generations ago) (28) (Fig. 2, A and D, fuchsia box 1), with distinct sources from Europe (most genetically similar to the Spanish), West Africa (the Yoruba), and the Americas (the Pima, the nearest sampled group in the Americas). A different method, which aims to detect but not date admixture, concluded that Cambodians trace ~16% of their DNA to a group equally related to modern-day Europeans and East Asians (29). GLOBETROTTER infers a ~19% contribution from a similar source related to modern-day Central, South, and East Asians and an ~81% contribution from a source related specifically to modern-day Han and Dai, the latter a branch of the Tai people who entered the region in historical times (30) (Fig. 2D, orange box 5). Further, this event dates to 1362 CE (1194 to 1502 CE), a period spanning the end of the Indianized Khmer empire (802 to 1431 CE) (30), one of the most powerful empires in Southeast Asia, whose fall was hypothesized to relate to a Tai influx (30). A comparison with the historical record becomes progressively more difficult for older episodes. Even when events are well attested, their exact genetic impacts (if any) are rarely if ever known, motivating our approach. Nevertheless, we have identified nine groups of populations showing related events, incorporating almost all (19/20) with the strongest GLOBETROTTER admixture evidence (9). Results are presented as online maps (26). Some events appear to match well with particular historical occurrences, such as the so-called Bantu Expansion into Southern Africa (9). Events affecting a group of seven populations (Fig. 2D, purple box 4) correspond in time to the rapid expansion, initiated by Genghis Khan, of the Mongol empire (1206 to 1368 CE) (31), one of the most dramatic events in human history. These populations, including the Hazara (32, 33), the Uygur (34), and the Mongola themselves, were sampled from within the range of the Mongol empire and show an admixture event dating within the Mongol Period, with one source closely genetically related to the Mongola that progressively decreases in proportion westward, to 8% in the Turkish (Fig. 2D). Seventeen populations from the Mediterranean, the Near East, and countries bordering the Arabian Sea (Fig. 2D, blue box 3) show signals of admixture from sub-Saharan Africa, with most recent dates in the range 890 to 1754 CE (Fig. 2, B and D). We interpret these signals, consistent with overlapping results of previous studies (4, 20), as resulting from the Arab expansion and slave trade, which originated around the seventh century CE (35). Our event dates are highly consistent with this but also imply earlier sub-Saharan African gene flow into, for example, the Moroccans. The highest-contributing sub-Saharan donor is West African for all 12 Mediterranean populations and an East or South African Bantu-speaking group for all five Arabian Sea populations (Fig. 2D), confirming genetically different sources for these slave trades (35). A population group centered around Eastern Europe shows signals of complex admixture. FineSTRUCTURE did not fully separate groups from this region, suggesting masked shared events might be present. We therefore repainted them excluding each other as donors: We performed similar reanalyses of five additional geographic regions for the same reason (table S16 and figs. S16 to S21). The easterly Russians and Chuvash both show evidence (P < 0.05) of admixture at more than one time (Fig. 2D), at least partially predating the Mongol empire, between groups with ancestry related to Northeast Asians (e.g., the Oroqen, Mongola, and Yakut) and Europeans, respectively (table S16). Six other European populations (Fig. 2D, pink/maroon box 2) independently show evidence after the repainting for similar admixture events involving more than two groups (P < 0.02) at about the same time (Fig. 3). CIs for the admixture time(s) overlap but predate the Mongol empire, with estimates from 440 to 1080 CE (Fig. 3). In each population, one source group has at least some ancestry related to Northeast Asians, with ~2 to 4% of these groups’ total ancestry linking directly to East Asia. This signal might correspond to a small genetic legacy from invasions of peoples from the Asian steppes (e.g., the Huns, Magyar, and Bulgars) during the first millennium CE (36). The other two source groups appear much more local. One is more North European in the repainting, when we exclude other East European groups as donors, and is largely replaced by northern Slavic-speaking groups in our original analysis (Fig. 2D and table S12). The other source is more southerly (e.g., Greeks and West Asians). This local migration could explain a recent observation of an excess of identity-by-descent sharing in Eastern Europe—including in the Greeks, in whom we infer admixture involving a group represented by Poland, at the same time—that was dated to a wide range between 1000 and 2000 years ago (37). We speculate that these events may correspond to the Slavic expansion across this region at a similar time, perhaps related to displacement caused by the Eurasian steppe invaders (38). Download high-res image Open in new tab Download Powerpoint Fig. 3 Multiway admixture in Eastern Europe. Mixing percentages (pie graphs) and dates (white text) inferred by using the strongest admixture “direction” for six eastern European groups—Belarus (BE), Bulgaria (BU), Hungary (HU), Lithuania (LI), Poland (PO), Romania (RO), analyzed when disallowing copying from nearby groups—and Greece (GR), analyzed by using the full set of 94 donors. Mixing percentages indicate percentages for three geographic regions: “N. Europe” (Northwest Europe and East Europe from clades of table S11; blue), “Southern” (South Europe and West Asia; red), and “N.E. Asia” (Northeast Asia and Yakut; purple, also given above each pie), plus other (gray). All groups except Greece show evidence (P < 0.05) of multiway admixture involving sources along the approximate directions show by the arrows. Coancestry curves (black lines) for Bulgaria, fitted with an exponential decay curve (green lines), exemplify this multiway signal. Each pairing of the three donor groups, each a proxy for the admixture source from a different region (Norway, northeast Europe; Oroqen, Northeast Asia; and Greece, South Europe and West Asia), exhibits negative correlation (a dip) in ancestry weights at short genetic distances, implying at least three identifiably distinct ancestral sources mixing (approximately) simultaneously (9). Last, Central Asia shows a particularly complex inferred history after a reanalysis of 10 groups excluding each other as donors, with 9 of 10 groups showing diverse recent events (Fig. 4A). The exception is the Kalash, a genetically isolated (39) population from the Hindu Kush mountains of Pakistan (40). Distinct, ancient, and partially shared admixture signals (always dated older than 90 BCE) are seen in six groups (Fig. 4B), including the Kalash (Fig. 2C), whose strongest signal suggests a major admixture event (990 to 210 BCE) from a source related to present-day Western Eurasians, although we cannot identify the geographic origin precisely. This period overlaps that of Alexander the Great (356 to 323 BCE), whose army, local tradition holds, the Kalash are descended from (40), but these ancient events predate recorded history in the region, precluding confident interpretation. Download high-res image Open in new tab Download Powerpoint Fig. 4 Ancient and modern admixture in Central Asia. (A) Dates (white text) and minority contributing sources for recent inferred events in nine populations (circles), analyzed disallowing copying from nearby groups, show contributions from Northeast Asia (purple) in the Hazara (HA), Uygur (UY), and Uzbekistani (UZ); East Asia (maroon) in Burusho (BU); West Asia (brown) in Pathan (PA); and Africa (red) in Balochi (BA), Brahui (BR), Makrani (MA), and Sindhi (SI). Kalash (KA, gray) have no inferred recent event. (B) Inferred mixing percentages (pie graphs) and dates (white text gives upper CI bound) for additional, possibly shared, ancient events in seven groups (HA, UY, and UZ have no inferred ancient events). Pie graphs show inferred donor makeup of each group after removing the recent event contribution from (A), if any, with colors referring to donors from “East Asia” (Southeast Asia from clades of table S11; maroon), “Europe” (Northwest, East, and South Europe; fuchsia), “Central South Asia” (orange), “West Asia” (brown), and other (white). Arrows indicate “directions” of ancient admixture, with donor regions splitting into two pairs that represent different sources. Coancestry curves (black lines) for Sindhi are superimposed for two different donor pairs representing proxies for admixing groups with ancestry indicated by the solid circles, indicating highly different exponential decay rates fit as a mixture of 7 and 94 generations (green lines). Our results demonstrate that it is possible to elucidate the effect of ancient and modern migration events and to provide fine-scale details of the sources involved, the complexity of events, and the timing of mixing of groups by using genetic information alone. Where independent information exists from alternative historical or archaeological sources, our approach provides results consistent with known facts and determines the amount of genetic material exchanged. In other cases, novel mixture events we infer are plausible and often involve geographically nearby sources, supporting their validity. Admixture events within the past several thousand years affect most human populations, and this needs to be taken into account in inferences aiming to look at the more distant history of our species. Future improvements in whole-genome sequencing, greater sample sizes, and incorporation of ancient DNA, together with additional methodological extensions, are likely to allow better understanding of ancient events where little or no historical record exists, to identify many additional events, to infer sex biases, and to provide more precise event characterization than currently possible. We believe our approach will extend naturally to these settings, as well as to other species. Supplementary Materials http://www.sciencemag.org/content/343/6172/747/suppl/DC1
Materials and Methods
Supplementary Text
Figs. S1 to S21
Tables S1 to S16
Appendix
References (41–82)
References and Notes
↵ D. Falush, M. Stephens, J. K. Pritchard, Inference of population structure using multilocus genotype data: Linked loci and correlated allele frequencies. Genetics 164, 1567–1587 (2003). pmid:12930761Abstract/FREE Full TextGoogle Scholar
S. J. E. Baird, Phylogenetics: Fisher’s markers of admixture. Heredity 97, 81–83 (2006). doi:10.1038/sj.hdy.6800850 pmid:16773121CrossRefPubMedWeb of ScienceGoogle Scholar
J. E. Pool, R. Nielsen, Inference of historical changes in migration rate from the lengths of migrant tracts. Genetics 181, 711–719 (2009). doi:10.1534/genetics.108.098095 pmid:19087958Abstract/FREE Full TextGoogle Scholar
↵ P. Moorjani, N. Patterson, J. N. Hirschhorn, A. Keinan, L. Hao, G. Atzmon, E. Burns, H. Ostrer, A. L. Price, D. Reich, The history of African gene flow into Southern Europeans, Levantines, and Jews. PLOS Genet. 7, e1001373 (2011). doi:10.1371/journal.pgen.1001373 pmid:21533020CrossRefPubMedGoogle Scholar
↵ I. Pugach, R. Matveyev, A. Wollstein, M. Kayser, M. Stoneking, Dating the age of admixture via wavelet transform analysis of genome-wide data. Genome Biol. 12, R19 (2011). doi:10.1186/gb-2011-12-2-r19 pmid:21352535CrossRefPubMedGoogle Scholar
↵ J. K. Pritchard, M. Stephens, P. Donnelly, Inference of population structure using multilocus genotype data. Genetics 155, 945–959 (2000). pmid:10835412Abstract/FREE Full TextGoogle Scholar
↵ D. H. Alexander, J. Novembre, K. Lange, Fast model-based estimation of ancestry in unrelated individuals. Genome Res. 19, 1655–1664 (2009). doi:10.1101/gr.094052.109 pmid:19648217Abstract/FREE Full TextGoogle Scholar
↵ D. J. Lawson, G. Hellenthal, S. Myers, D. Falush, Inference of population structure using dense haplotype data. PLOS Genet. 8, e1002453 (2012). doi:10.1371/journal.pgen.1002453 pmid:22291602CrossRefPubMedGoogle Scholar
↵
Information on materials and methods is available on Science Online.
↵L. L. Cavalli Sforza, W. Bodmer, The Genetics of Human Populations (Freeman, San Francisco, CA, 1971).
↵ P.-R. Loh, M. Lipson, N. Patterson, P. Moorjani, J. K. Pickrell, D. Reich, B. Berger, Inferring admixture histories of human populations using linkage disequilibrium. Genetics 193, 1233–1254 (2013). doi:10.1534/genetics.112.147330 pmid:23410830Abstract/FREE Full TextGoogle Scholar
↵ A. L. Price, N. J. Patterson, R. M. Plenge, M. E. Weinblatt, N. A. Shadick, D. Reich, Principal components analysis corrects for stratification in genome-wide association studies. Nat. Genet. 38, 904–909 (2006). doi:10.1038/ng1847 pmid:16862161CrossRefPubMedWeb of ScienceGoogle Scholar
↵ N. Patterson, A. L. Price, D. Reich, Population structure and eigenanalysis. PLOS Genet. 2, e190 (2006). doi:10.1371/journal.pgen.0020190 pmid:17194218CrossRefPubMedGoogle Scholar
↵ G. K. Chen, P. Marjoram, J. D. Wall, Fast and flexible simulation of DNA sequence data. Genome Res. 19, 136–142 (2009). doi:10.1101/gr.083634.108 pmid:19029539Abstract/FREE Full TextGoogle Scholar
↵ I. Gronau, M. J. Hubisz, B. Gulko, C. G. Danko, A. Siepel, Bayesian inference of ancient human demography from individual genome sequences. Nat. Genet. 43, 1031–1034 (2011). doi:10.1038/ng.937 pmid:21926973CrossRefPubMedGoogle Scholar
H. Li, R. Durbin, Inference of human population history from individual whole-genome sequences. Nature 475, 493–496 (2011). doi:10.1038/nature10231 pmid:21753753CrossRefPubMedWeb of ScienceGoogle Scholar
R. N. Gutenkunst, R. D. Hernandez, S. H. Williamson, C. D. Bustamante, Inferring the joint demographic history of multiple populations from multidimensional SNP frequency data. PLOS Genet. 5, e1000695 (2009). doi:10.1371/journal.pgen.1000695 pmid:19851460CrossRefPubMedGoogle Scholar
↵ A. Keinan, J. C. Mullikin, N. Patterson, D. Reich, Measurement of the human allele frequency spectrum demonstrates greater genetic drift in East Asians than in Europeans. Nat. Genet. 39, 1251–1255 (2007). doi:10.1038/ng2116 pmid:17828266CrossRefPubMedWeb of ScienceGoogle Scholar
↵ J. N. Fenner, Cross-cultural estimation of the human generation interval for use in genetics-based population divergence studies. Am. J. Phys. Anthropol. 128, 415–423 (2005). doi:10.1002/ajpa.20188 pmid:15795887CrossRefPubMedWeb of ScienceGoogle Scholar
↵ B. M. Henn, L. R. Botigué, S. Gravel, W. Wang, A. Brisbin, J. K. Byrnes, K. Fadhlaoui-Zid, P. A. Zalloua, A. Moreno-Estrada, J. Bertranpetit, C. D. Bustamante, D. Comas, Genomic ancestry of North Africans supports back-to-Africa migrations. PLOS Genet. 8, e1002397 (2012). doi:10.1371/journal.pgen.1002397 pmid:22253600CrossRefPubMedGoogle Scholar
↵ G. B. J. Busby, F. Brisighelli, P. Sánchez-Diz, E. Ramos-Luis, C. Martinez-Cadenas, M. G. Thomas, D. G. Bradley, L. Gusmão, B. Winney, W. Bodmer, M. Vennemann, V. Coia, F. Scarnicci, S. Tofanelli, G. Vona, R. Ploski, C. Vecchiotti, T. Zemunik, I. Rudan, S. Karachanak, D. Toncheva, P. Anagnostou, G. Ferri, C. Rapone, T. Hervig, T. Moen, J. F. Wilson, C. Capelli, The peopling of Europe and the cautionary tale of Y chromosome lineage R-M269. Proc. Biol. Sci. 279, 884–892 (2012). doi:10.1098/rspb.2011.1044 pmid:21865258Abstract/FREE Full TextGoogle Scholar
↵ J. Z. Li, D. M. Absher, H. Tang, A. M. Southwick, A. M. Casto, S. Ramachandran, H. M. Cann, G. S. Barsh, M. Feldman, L. L. Cavalli-Sforza, R. M. Myers, Worldwide human relationships inferred from genome-wide patterns of variation. Science 319, 1100–1104 (2008). doi:10.1126/science.1153717 pmid:18292342Abstract/FREE Full TextGoogle Scholar
↵ D. M. Behar, B. Yunusbayev, M. Metspalu, E. Metspalu, S. Rosset, J. Parik, S. Rootsi, G. Chaubey, I. Kutuev, G. Yudkovsky, E. K. Khusnutdinova, O. Balanovsky, O. Semino, L. Pereira, D. Comas, D. Gurwitz, B. Bonne-Tamir, T. Parfitt, M. F. Hammer, K. Skorecki, R. Villems, The genome-wide structure of the Jewish people. Nature 466, 238–242 (2010). doi:10.1038/nature09103 pmid:20531471CrossRefPubMedWeb of ScienceGoogle Scholar
↵ B. M. Henn, C. R. Gignoux, M. Jobin, J. M. Granka, J. M. Macpherson, J. M. Kidd, L. Rodríguez-Botigué, S. Ramachandran, L. Hon, A. Brisbin, A. A. Lin, P. A. Underhill, D. Comas, K. K. Kidd, P. J. Norman, P. Parham, C. D. Bustamante, J. L. Mountain, M. W. Feldman, Hunter-gatherer genomic diversity suggests a southern African origin for modern humans. Proc. Natl. Acad. Sci. U.S.A. 108, 5154–5162 (2011). doi:10.1073/pnas.1017511108 pmid:21383195Abstract/FREE Full TextGoogle Scholar
↵ B. N. Howie, P. Donnelly, J. Marchini, A flexible and accurate genotype imputation method for the next generation of genome-wide association studies. PLOS Genet. 5, e1000529 (2009). doi:10.1371/journal.pgen.1000529 pmid:19543373CrossRefPubMedGoogle Scholar
↵An online atlas of worldwide human genetic admixture history is available at http://admixturemap.paintmychromosomes.com.
↵ N. Patterson, P. Moorjani, Y. Luo, S. Mallick, N. Rohland, Y. Zhan, T. Genschoreck, T. Webster, D. Reich, Ancient admixture in human history. Genetics 192, 1065–1093 (2012). doi:10.1534/genetics.112.145037 pmid:22960212Abstract/FREE Full TextGoogle Scholar
↵
We converted g inferred generations to the admixture year: 1950 – (g + 1) × 28.
↵ J. K. Pickrell, J. K. Pritchard, Inference of population splits and mixtures from genome-wide allele frequency data. PLOS Genet. 8, e1002967 (2012). doi:10.1371/journal.pgen.1002967 pmid:23166502CrossRefPubMedGoogle Scholar
↵D. Chandler, A History of Cambodia (Westview, Boulder, CO, ed. 4, 2007).
↵C. P. Atwood, Encyclopedia of Mongolia and the Mongol Empire (Facts on File, New York, 2004).
↵ E. E. Bacon, The inquiry into the history of the Hazara Mongols of Afghanistan. Southwest. J. Anthropol. 7, 230–247 (1951).Google Scholar
↵ T. Zerjal, Y. Xue, G. Bertorelle, R. S. Wells, W. Bao, S. Zhu, R. Qamar, Q. Ayub, A. Mohyuddin, S. Fu, P. Li, N. Yuldasheva, R. Ruzibakiev, J. Xu, Q. Shu, R. Du, H. Yang, M. E. Hurles, E. Robinson, T. Gerelsaikhan, B. Dashnyam, S. Q. Mehdi, C. Tyler-Smith, The genetic legacy of the Mongols. Am. J. Hum. Genet. 72, 717–721 (2003). doi:10.1086/367774 pmid:12592608CrossRefPubMedWeb of ScienceGoogle Scholar
↵ S. Xu, L. Jin, A genome-wide analysis of admixture in Uyghurs and a high-density admixture map for disease-gene discovery. Am. J. Hum. Genet. 83, 322–336 (2008). doi:10.1016/j.ajhg.2008.08.001 pmid:18760393CrossRefPubMedWeb of ScienceGoogle Scholar
↵M. Gordon, Slavery in the Arab World (New Amsterdam, New York, ed. 1, 1989).
↵P. Heather, Empires and Barbarians: Migration, Development and the Birth of Europe (Macmillan, London, 2009).
↵ P. Ralph, G. Coop, The geography of recent genetic ancestry across Europe. PLOS Biol. 11, e1001555 (2013). doi:10.1371/journal.pbio.1001555 pmid:23667324CrossRefPubMedGoogle Scholar
↵C. I. Beckwith, Empires of the Silk Road: A History of Central Eurasia from the Bronze Age to the Present (Princeton Univ. Press, Princeton, NJ, 2006).
↵ N. A. Rosenberg, J. K. Pritchard, J. L. Weber, H. M. Cann, K. K. Kidd, L. A. Zhivotovsky, M. W. Feldman, Genetic structure of human populations. Science 298, 2381–2385 (2002). doi:10.1126/science.1078311 pmid:12493913Abstract/FREE Full TextGoogle Scholar
↵M. Lines, The Kalasha People of North-Western Pakistan (Emjay Books International, Peshawar, Pakistan, 1999).
↵ R. Chakraborty, K. M. Weiss, Admixture as a tool for finding linked genes and detecting that difference from allelic association between loci. Proc. Natl. Acad. Sci. U.S.A. 85, 9119–9123 (1988). doi:10.1073/pnas.85.23.9119 pmid:3194414Abstract/FREE Full TextGoogle Scholar
N. Li, M. Stephens, Modeling linkage disequilibrium and identifying recombination hotspots using single-nucleotide polymorphism data. Genetics 165, 2213–2233 (2003). pmid:14704198Abstract/FREE Full TextGoogle Scholar
International HapMap Consortium, The International HapMap Project. Nature 426, 789–796 (2003). doi:10.1038/nature02168 pmid:14685227CrossRefPubMedWeb of ScienceGoogle Scholar
International HapMap Consortium, A second generation human haplotype map of over 3.1 million SNPs. Nature 449, 851–861 (2007). doi:10.1038/nature06258 pmid:17943122CrossRefPubMedWeb of ScienceGoogle Scholar
A. Kong, D. F. Gudbjartsson, J. Sainz, G. M. Jonsdottir, S. A. Gudjonsson, B. Richardsson, S. Sigurdardottir, J. Barnard, B. Hallbeck, G. Masson, A. Shlien, S. T. Palsson, M. L. Frigge, T. E. Thorgeirsson, J. R. Gulcher, K. Stefansson, A high-resolution recombination map of the human genome. Nat. Genet. 31, 241–247 (2002). pmid:12053178CrossRefPubMedWeb of ScienceGoogle Scholar
A. G. Hinch, A. Tandon, N. Patterson, Y. Song, N. Rohland, C. D. Palmer, G. K. Chen, K. Wang, S. G. Buxbaum, E. L. Akylbekova, M. C. Aldrich, C. B. Ambrosone, C. Amos, E. V. Bandera, S. I. Berndt, L. Bernstein, W. J. Blot, C. H. Bock, E. Boerwinkle, Q. Cai, N. Caporaso, G. Casey, L. A. Cupples, S. L. Deming, W. R. Diver, J. Divers, M. Fornage, E. M. Gillanders, J. Glessner, C. C. Harris, J. J. Hu, S. A. Ingles, W. Isaacs, E. M. John, W. H. Kao, B. Keating, R. A. Kittles, L. N. Kolonel, E. Larkin, L. Le Marchand, L. H. McNeill, R. C. Millikan, A. Murphy, S. Musani, C. Neslund-Dudas, S. Nyante, G. J. Papanicolaou, M. F. Press, B. M. Psaty, A. P. Reiner, S. S. Rich, J. L. Rodriguez-Gil, J. I. Rotter, B. A. Rybicki, A. G. Schwartz, L. B. Signorello, M. Spitz, S. S. Strom, M. J. Thun, M. A. Tucker, Z. Wang, J. K. Wiencke, J. S. Witte, M. Wrensch, X. Wu, Y. Yamamura, K. A. Zanetti, W. Zheng, R. G. Ziegler, X. Zhu, S. Redline, J. N. Hirschhorn, B. E. Henderson, H. A. Taylor Jr., A. L. Price, H. Hakonarson, S. J. Chanock, C. A. Haiman, J. G. Wilson, D. Reich, S. R. Myers, The landscape of recombination in African Americans. Nature 476, 170–175 (2011). doi:10.1038/nature10336 pmid:21775986CrossRefPubMedWeb of ScienceGoogle Scholar
P. Scheet, M. Stephens, A fast and flexible statistical model for large-scale population genotype data: Applications to inferring missing genotypes and haplotypic phase. Am. J. Hum. Genet. 78, 629–644 (2006). doi:10.1086/502802 pmid:16532393CrossRefPubMedWeb of ScienceGoogle Scholar
A. L. Price, A. Tandon, N. Patterson, K. C. Barnes, N. Rafaels, I. Ruczinski, T. H. Beaty, R. Mathias, D. Reich, S. Myers, Sensitive detection of chromosomal segments of distinct ancestry in admixed populations. PLOS Genet. 5, e1000519 (2009). doi:10.1371/journal.pgen.1000519 pmid:19543370CrossRefPubMedGoogle Scholar
F. M. T. A. Busing, E. Meijer, R. Van Der Leeden, Delete-m Jackknife for Unequal m. Stat. Comput. 9, 3–8 (1999). doi:10.1023/A:1008800423698CrossRefWeb of ScienceGoogle Scholar
G. T. Marth, E. Czabarka, J. Murvai, S. T. Sherry, The allele frequency spectrum in genome-wide human variation data reveals signals of differential demographic history in three large world populations. Genetics 166, 351–372 (2004). doi:10.1534/genetics.166.1.351 pmid:15020430Abstract/FREE Full TextGoogle Scholar
O. Delaneau, J. Marchini, J. F. Zagury, A linear complexity phasing method for thousands of genomes. Nat. Methods 9, 179–181 (2012). doi:10.1038/nmeth.1785 pmid:22138821CrossRefPubMedWeb of ScienceGoogle Scholar
O. Delaneau, J. F. Zagury, J. Marchini, Improved whole-chromosome phasing for disease and population genetic studies. Nat. Methods 10, 5–6 (2013). doi:10.1038/nmeth.2307 pmid:23269371CrossRefPubMedWeb of ScienceGoogle Scholar
A. Kong, G. Thorleifsson, D. F. Gudbjartsson, G. Masson, A. Sigurdsson, A. Jonasdottir, G. B. Walters, A. Jonasdottir, A. Gylfason, K. T. Kristinsson, S. A. Gudjonsson, M. L. Frigge, A. Helgason, U. Thorsteinsdottir, K. Stefansson, Fine-scale recombination rate differences between sexes, populations and individuals. Nature 467, 1099–1103 (2010). doi:10.1038/nature09525 pmid:20981099CrossRefPubMedWeb of ScienceGoogle Scholar
S. Purcell, B. Neale, K. Todd-Brown, L. Thomas, M. A. R. Ferreira, D. Bender, J. Maller, P. Sklar, P. I. W. de Bakker, M. J. Daly, P. C. Sham, PLINK: A tool set for whole-genome association and population-based linkage analyses. Am. J. Hum. Genet. 81, 559–575 (2007). doi:10.1086/519795 pmid:17701901CrossRefPubMedGoogle Scholar
M. Ruhlen, A Guide to the World’s Languages: Volume I, Classification (Stanford Univ. Press, Stanford, CA, 1991).
E. E. Bacon, The inquiry into the history of the Hazara Mongols of Afghanistan. Southwest. J. Anthropol. 7, 230–247 (1951).Google Scholar
S. Xu, W. Huang, J. Qian, L. Jin, Analysis of genomic admixture in Uyghur and its implication in mapping strategy. Am. J. Hum. Genet. 82, 883–894 (2008). doi:10.1016/j.ajhg.2008.01.017 pmid:18355773CrossRefPubMedWeb of ScienceGoogle Scholar
D. W. Anthony, The Horse The Wheel and Language: How Bronze-Age Riders from the Eurasian Steppes Shaped the Modern World (Princeton Univ. Press, Princeton, NJ, 2007).
M. Richards, C. Rengo, F. Cruciani, F. Gratrix, J. F. Wilson, R. Scozzari, V. Macaulay, A. Torroni, Extensive female-mediated gene flow from sub-Saharan Africa into near eastern Arab populations. Am. J. Hum. Genet. 72, 1058–1064 (2003). doi:10.1086/374384 pmid:12629598CrossRefPubMedWeb of ScienceGoogle Scholar
N. M. Abu Izzeddin, The Druzes: A New Study of Their History, Faith and Society (Brill, Leiden, Netherlands, ed. 2, 1993).
R. Elphick, H. B. Gilomee, J. C. Armstrong, The Shaping of South African Society, 1652-1840 (Wesleyan Univ. Press, Middletown, CT, ed. 1, 1989).
J. Diamond, P. Bellwood, Farmers and their languages: The first expansions. Science 300, 597–603 (2003). doi:10.1126/science.1078208 pmid:12714734Abstract/FREE Full TextGoogle Scholar
J. K. Pickrell, N. Patterson, C. Barbieri, F. Berthold, L. Gerlach, T. Güldemann, B. Kure, S. W. Mpoloka, H. Nakagawa, C. Naumann, M. Lipson, P. R. Loh, J. Lachance, J. Mountain, C. D. Bustamante, B. Berger, S. A. Tishkoff, B. M. Henn, M. Stoneking, D. Reich, B. Pakendorf, The genetic prehistory of southern Africa. Nat Commun 3, 1143 (2012). doi:10.1038/ncomms2140 pmid:23072811CrossRefPubMedGoogle Scholar
P. Mitchell, The Archaeology of Southern Africa (Cambridge Univ. Press, Cambridge, 2002).
P. Mitchell, Genetics and southern African prehistory: An archaeological view. J. Anthropol. Sci. 88, 73–92 (2010). pmid:20834051PubMedWeb of ScienceGoogle Scholar
S. Wolpert, A New History of India (Oxford Univ. Press, New York, 2000).
J. S. Olson, An Ethnohistorical Dictionary of China (Greenwood, Westport, CT, 1998).
L Fengxiang, L Whaley
S. A. Tishkoff, F. A. Reed, F. R. Friedlaender, C. Ehret, A. Ranciaro, A. Froment, J. B. Hirbo, A. A. Awomoyi, J. M. Bodo, O. Doumbo, M. Ibrahim, A. T. Juma, M. J. Kotze, G. Lema, J. H. Moore, H. Mortensen, T. B. Nyambo, S. A. Omar, K. Powell, G. S. Pretorius, M. W. Smith, M. A. Thera, C. Wambebe, J. L. Weber, S. M. Williams, The genetic structure and history of Africans and African Americans. Science 324, 1035–1044 (2009). doi:10.1126/science.1172257 pmid:19407144Abstract/FREE Full TextGoogle Scholar
C. Ehret, M. Posnansky, “The first spread of food production to Africa,” in The Archaeological and Liguistic Reconstruction of African History (Univ. of California Press, Berkeley, CA, 1982).
M. Maceachern, “Two thousand years of West African history,” in African Archaeology, A. B. Stahl, Ed. (Blackwell, Oxford, 2005).
V. Lieberman, Strange Parallels: South-East Asia in a Global Context: 800-1830, Volume 1: Integration with the Mainland (Cambridge Univ. Press, Cambridge, 2003).
R. Chaix, C. Cao, P. Donnelly, Is mate choice in humans MHC-dependent? PLOS Genet. 4, e1000184 (2008). doi:10.1371/journal.pgen.1000184 pmid:18787687CrossRefPubMedGoogle Scholar
J. K. Pritchard, M. Przeworski, Linkage disequilibrium in humans: Models and data. Am. J. Hum. Genet. 69, 1–14 (2001). doi:10.1086/321275 pmid:11410837CrossRefPubMedWeb of ScienceGoogle Scholar
A. J. Jeffreys, L. Kauppi, R. Neumann, Intensely punctate meiotic recombination in the class II region of the major histocompatibility complex. Nat. Genet. 29, 217–222 (2001). doi:10.1038/ng1001-217 pmid:11586303CrossRefPubMedWeb of ScienceGoogle Scholar
D. C. Crawford, T. Bhangale, N. Li, G. Hellenthal, M. J. Rieder, D. A. Nickerson, M. Stephens, Evidence for substantial fine-scale variation in recombination rates across the human genome. Nat. Genet. 36, 700–706 (2004). doi:10.1038/ng1376 pmid:15184900CrossRefPubMedWeb of ScienceGoogle Scholar
G. A. McVean, S. R. Myers, S. Hunt, P. Deloukas, D. R. Bentley, P. Donnelly, The fine-scale structure of recombination rate variation in the human genome. Science 304, 581–584 (2004). doi:10.1126/science.1092500 pmid:15105499Abstract/FREE Full TextGoogle Scholar
P. Fearnhead, N. G. Smith, A novel method with improved power to detect recombination hotspots from polymorphism data reveals multiple hotspots in human genes. Am. J. Hum. Genet. 77, 781–794 (2005). doi:10.1086/497579 pmid:16252238CrossRefPubMedWeb of ScienceGoogle Scholar
S. Myers, L. Bottolo, C. Freeman, G. McVean, P. Donnelly, A fine-scale map of recombination rates and hotspots across the human genome. Science 310, 321–324 (2005). doi:10.1126/science.1117196 pmid:16224025Abstract/FREE Full TextGoogle Scholar
J. L. Newman, The Peopling of Africa (Yale Univ. Press, New Haven, CT, 1995).
L. Pagani, T. Kivisild, A. Tarekegn, R. Ekong, C. Plaster, I. Gallego Romero, Q. Ayub, S. Q. Mehdi, M. G. Thomas, D. Luiselli, E. Bekele, N. Bradman, D. J. Balding, C. Tyler-Smith, Ethiopian genetic diversity reveals linguistic stratification and complex influences on the Ethiopian gene pool. Am. J. Hum. Genet. 91, 83–96 (2012). doi:10.1016/j.ajhg.2012.05.015 pmid:22726845CrossRefPubMedGoogle Scholar
↵ L. R. Rabiner, A tutorial on hidden Markov models and selected applications in speech recognition. Proc. IEEE 77, 257–286 (1989). doi:10.1109/5.18626CrossRefWeb of ScienceGoogle Scholar
Acknowledgments: We are grateful for the John Fell Fund–University of Oxford, the NIH, the Wellcome Trust (S.M., grant 098387/Z/12/Z), the Biotechnology and Biological Sciences Research Council, the Royal Society/Wellcome Trust (G.H., grant 098386/Z/12/Z), and the Istituto Italiano di Antropologia for funding. J.F.W. is a director, stockholder, and employee of ScotlandsDNA (and formerly of EthnoAncestry). We thank S. Karachanak, D. Toncheva, P. Anagnostou, F. Cali, F. Brisighelli, V. Romano, G. LeFranc, C. Buresi, J. Ben Chibani, A. Haj-Khelil, S. Denden, R. Ploski, T. Hervig, T. Moen, P. Krajewski, and R. Herrera for providing samples for our genotyping and the blood donors and the staff of the Unità Operativa Complessa di Medicina Trasfusionale, Azienda Ospedaliera Umberto I, Siracusa (Italy). Data analyzed in this study may be downloaded via http://admixturemap.paintmychromosomes.com/. Raw genotype data are available at the Gene Expression Omnibus database online (www.ncbi.nlm.nih.gov/geo/), series accession number GSE53626.


Նոր բացայայտում հին Եգիպտական թագաւորների DNA-ի մասին՝ The First Genome Data from Ancient Egyptian Mummies


Материал скомпонован и отредактирован: Аршам Агамалян
|
|
=== result ===
|
|
| Click on icons for more info | ||
